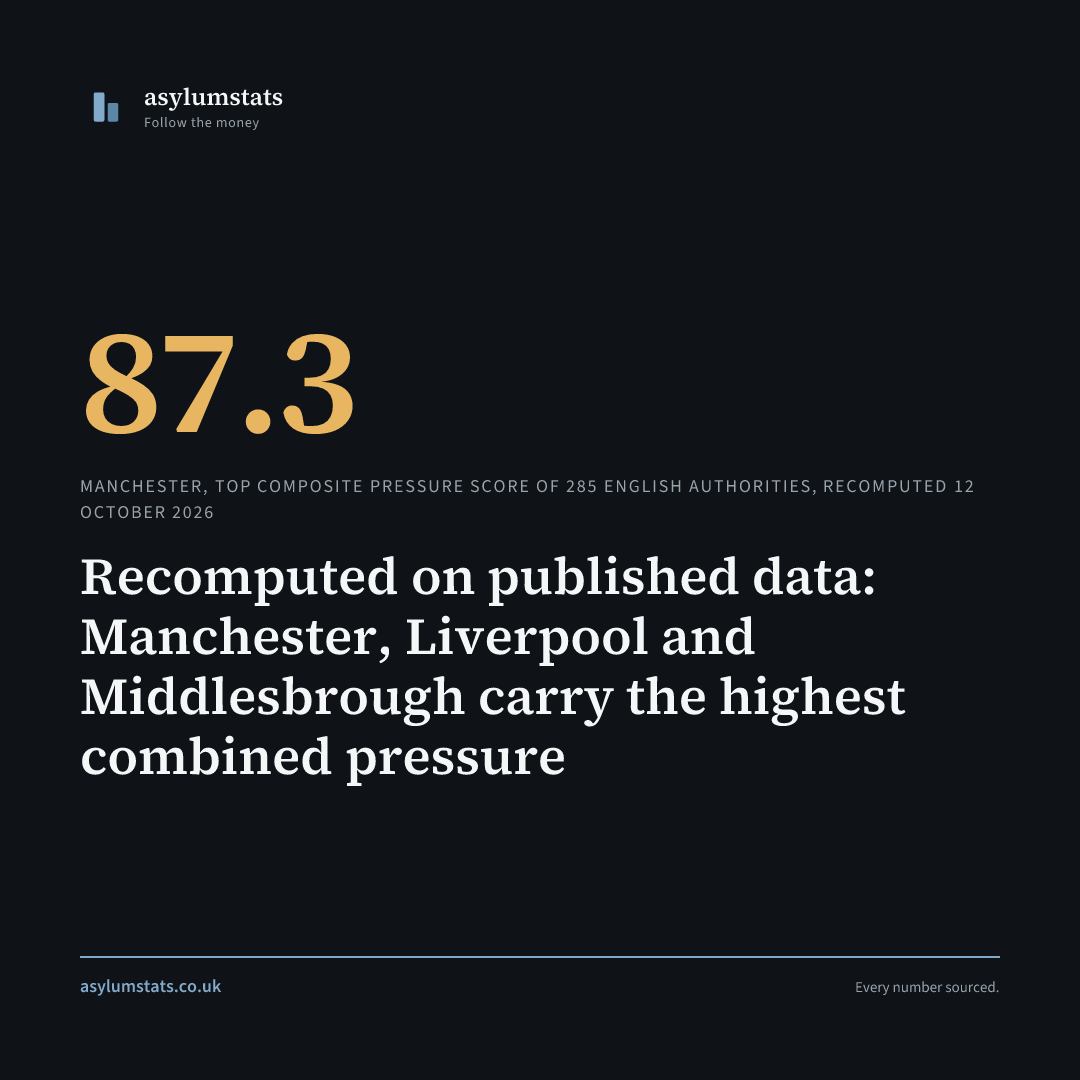
Recomputed on published data: Manchester, Liverpool and Middlesbrough carry the highest combined pressure
Correction, 12 October 2026. This page was headlined “Recomputed: Blackburn, Blackpool and Pendle carry the highest combined pressure”, on five domains. Three of them, police recorded crime, adult social care spend and SEND growth, came from 25-authority files typed into this site’s source by hand in April 2026, with no raw file or script behind them, and they could not be traced to ONS, NHS Digital or DfE tables. Those files gave adult social care and SEND figures for district councils, which run neither service, and filed Preston, Staffordshire and Worcestershire under the wrong area codes. The table this page printed, Blackburn with Darwen 83.4, Blackpool 79.9, Pendle 78.9, Doncaster 76.6, Burnley 75.7, Hyndburn 75.1 and Preston 75.0, ranked only those 25 areas and is withdrawn, with its crime column.
Police recorded crime is no longer a domain. This site does not set recorded crime beside asylum support; UK Demographics publishes crime in its own context. The four remaining domains keep equal weights, a quarter each instead of a fifth. SEND and adult social care now come from the published DfE 2025/26 and DHSC 2024-25 tables, for every council. Recomputed across the 285 English authorities that hold all four domains, Manchester is first on 87.3, Liverpool second on 85.9 and Middlesbrough third on 83.6. Of the seven councils this page named, Pendle is fourth, Blackburn with Darwen fifth, Burnley sixth, Preston tenth, Hyndburn sixteenth, Blackpool forty-sixth and Doncaster sixty-sixth.
The composite index combines four domains at local authority level. Each is converted to a percentile rank against every authority holding that dataset, then averaged, with equal weights, across the domains an area has:
- Asylum support rate per 10,000 residents, against all 361 UK local authorities (Home Office local authority data, 30 June 2026)
- Demographic change, the absolute annual percentage-point move in White British share between the 2011 and 2021 Censuses
- Five-year growth in pupils with an EHC plan, 2020/21 to 2025/26 (DfE, Special educational needs in England)
- Adult social care gross spend per resident aged 18 and over, 2024-25 (DHSC, Adult social care finance report, Table 14)
SEND and adult social care are run by upper-tier councils, so a two-tier district takes its county’s figure and its county’s percentile, and those two distributions hold one figure per council that runs the service.
Recomputed on 12 October 2026, the 285 English authorities with all four domains:
| Rank | Council | Score | ASC | SEND | Asylum | Demographic |
|---|---|---|---|---|---|---|
| 1 | Manchester | 87.3 | 80 | 91 | 88 | 91 |
| 2 | Liverpool | 85.9 | 76 | 97 | 95 | 75 |
| 3 | Middlesbrough | 83.6 | 87 | 84 | 97 | 66 |
| 4 | Pendle | 83.4 | 72 | 72 | 98 | 93 |
| 5 | Blackburn with Darwen | 80.5 | 75 | 62 | 98 | 86 |
| 6 | Burnley | 79.5 | 72 | 72 | 99 | 76 |
| 7 | Newcastle upon Tyne | 79.4 | 90 | 65 | 89 | 74 |
Columns after the score are percentile ranks, where 100 is the most pressured. Pendle’s and Burnley’s social care and SEND columns are Lancashire County Council’s.
Caveats. Authorities in Wales, Scotland and Northern Ireland score on fewer domains, because the SEND and social care figures cover England, and they are not ranked here. The domains are different vintages: SEND is the 2025/26 school year, social care 2024-25, the asylum figure 30 June 2026 and the demographic rate the Censuses of 2011 and 2021. The ranking will move whenever any of the four publishes, which is the point of dating it.
This index measures the co-occurrence of pressures on councils and public services. It does not claim that any one domain causes another.
Share this finding. Right-click to save the image.