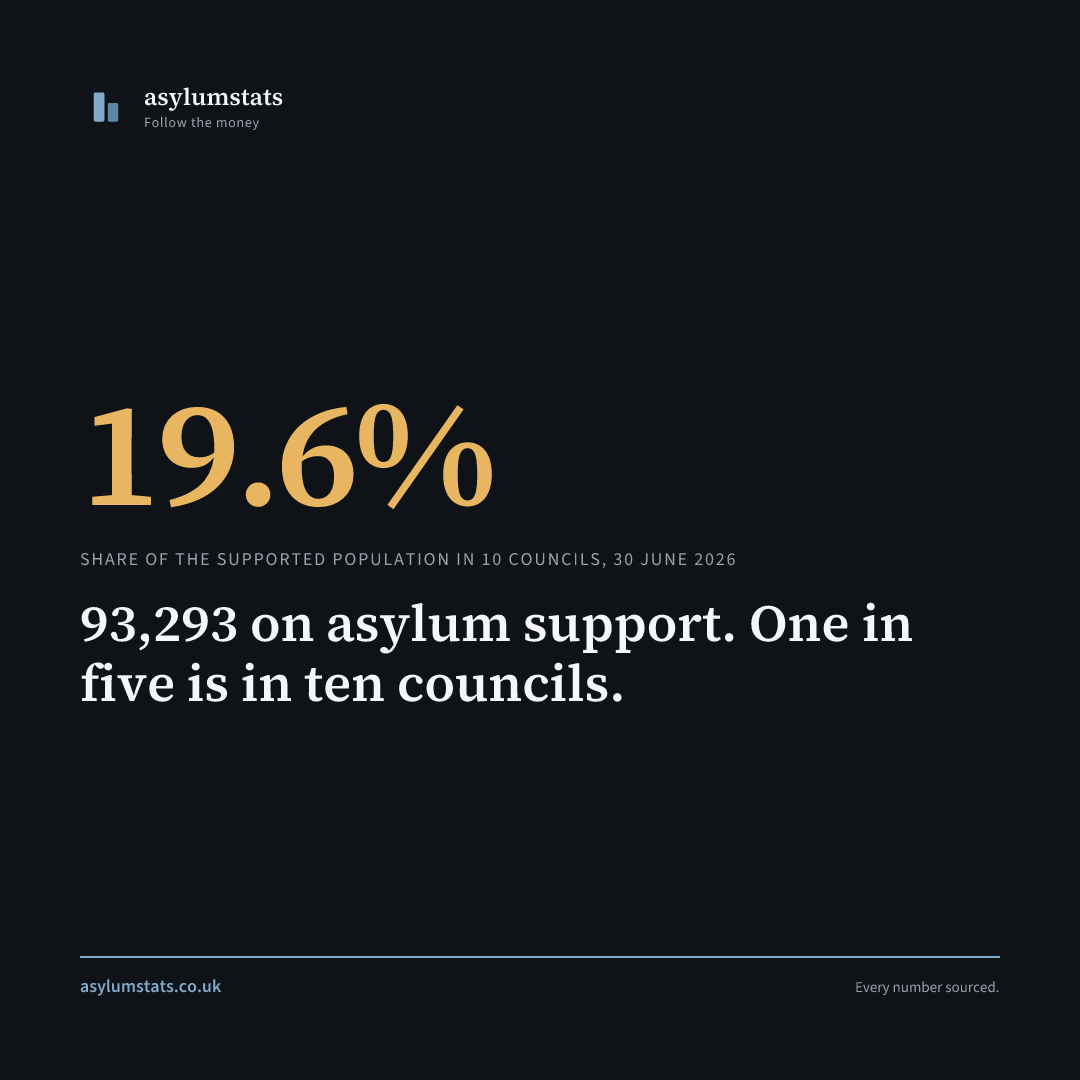
93,293 on asylum support. One in five is in ten councils.
18,301 of the 93,293 people on asylum support at 30 June 2026 were in ten local authorities. That is 19.6% of the national total in ten places out of 361.
| Council | On asylum support |
|---|---|
| Glasgow City | 3,938 |
| Birmingham | 2,136 |
| Liverpool | 1,961 |
| Coventry | 1,700 |
| Belfast | 1,540 |
| Manchester | 1,509 |
| Sandwell | 1,467 |
| Leeds | 1,365 |
| Nottingham | 1,352 |
| Leicester | 1,333 |
The total is falling. The concentration is not. The supported population has come down from 107,003 at 31 December 2025 and a peak of 123,758 in September 2023. The share sitting in the top ten councils has moved by less than a point across the same period.
That is the finding. Dispersal policy has reduced the number of people in the system faster than it has spread them out, so the places carrying the most are carrying a smaller number of a smaller total, in the same order as before.
Counted per head of population rather than in absolute numbers, the table looks different again, and none of the ten largest is at the top of it. That list is in Four Lancashire authorities are in the national top nine.
Share this finding. Right-click to save the image.