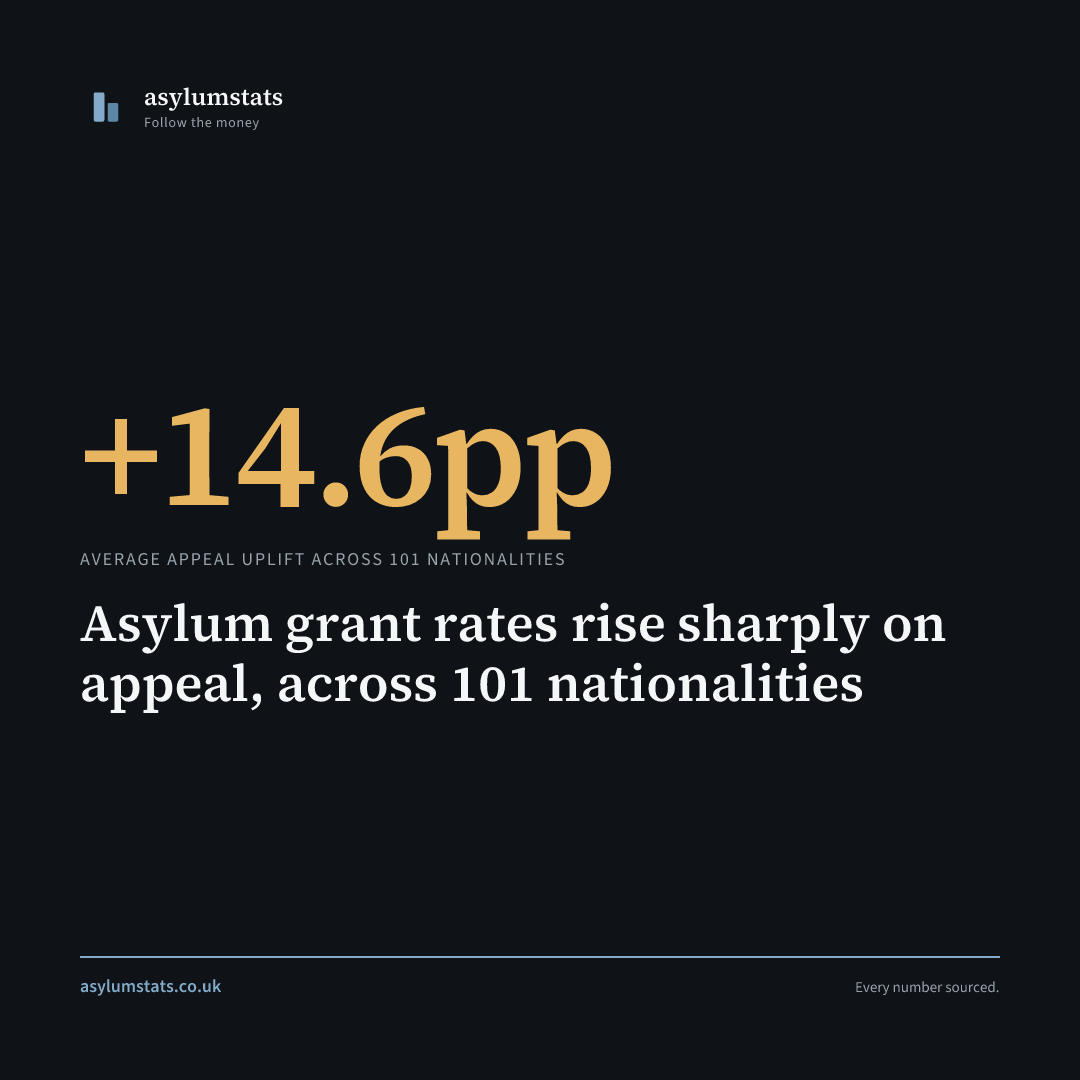
Asylum grant rates rise sharply on appeal, across 101 nationalities
The initial-decision grant rate is not the final grant rate, and the gap is large. The Home Office publishes both, in the Asy_D04 Outcome Analysis dataset released 21 May 2026. Almost nobody quotes the second one.
When the Home Office initial-decision system refuses an asylum claim, the refused applicant can appeal to the First-Tier Tribunal (Immigration and Asylum Chamber). Of the 105 nationalities tracked in the Asy_D04 outcome analysis dataset, 101 see the appeal process lift the grant rate, by an average of 14.6 percentage points compared with the initial decision. Four see it fall. Across all 105, including those four, the average is 14.0 percentage points.
For some nationalities the gap is enormous.
| Nationality | Initial grant rate | After appeals | Uplift | Substantive decisions |
|---|---|---|---|---|
| Sri Lanka | 26.9% | 60.1% | +33.1pp | 5,503 |
| DR Congo | 33.5% | 60.3% | +26.9pp | 1,097 |
| Iraq | 30.9% | 57.0% | +26.1pp | 23,948 |
| Zimbabwe | 23.9% | 48.8% | +24.9pp | 1,301 |
| Russia | 57.8% | 79.4% | +21.7pp | 1,309 |
| Ethiopia | 59.2% | 80.3% | +21.0pp | 4,333 |
| Cameroon | 53.9% | 74.2% | +20.3pp | 1,524 |
| Iran | 66.7% | 85.8% | +19.1pp | 40,466 |
| Albania | 15.1% | 31.7% | +16.6pp | 14,462 |
| Vietnam | 49.0% | 65.2% | +16.2pp | 6,664 |
| Pakistan | 35.8% | 49.8% | +14.0pp | 15,861 |
The biggest UK asylum cohort, Iran (40,466 substantive decisions tracked in Asy_D04), sees its 66.7 percent initial grant rate rise to 85.8 percent after appeals. Iraq, with 23,948 substantive decisions tracked, sees 30.9 percent initial grants rise to 57.0 percent. An Iraqi claim that the Home Office initially refused had close to a one-in-two chance of being granted on appeal.
This is not new. The same pattern appeared in the December 2025 release and the December 2024 release. The May 2026 release confirms it.
What this means for the headline grant rate
The Home Office’s published initial grant rate for year ending March 2026 was 39 percent, down from 49 percent the previous year. Politicians have quoted that 10-percentage-point fall as evidence of a tougher system. The Asy_D04 data shows the grant rate rising by roughly 14 percentage points between initial decision and final outcome. Applied to the published 39 percent, the “true” grant rate after appeals is closer to 53 percent. Across the whole 2015 to 2023 caseload the shift is 50.8 percent to 66.1 percent, a weighted 15.3 points.
The decline in the initial-decision rate is real. The decline in the actual outcome rate is much smaller. The Home Office is refusing more claims and losing more appeals.
The cost
Each appealed claim runs through three to twelve months of legal proceedings before the First-Tier Tribunal. The applicant is supported on Section 95 asylum support throughout the wait, at a cost calculated by Home Office submissions at approximately £40 per day per person plus accommodation. Legal aid for the appellant runs to around £1,000 to £3,000 per case in publicly funded cases. The Tribunal Service estimates the public cost per asylum appeal at £700 to £1,400.
Multiplied across the 50,000 to 70,000 initial refusals each year that proceed to appeal, the appeal-stage costs alone run into the hundreds of millions of pounds annually. Some of that cost reflects initial decisions that were wrong. Some reflects evidence that only emerged at appeal, or country conditions that changed while the claim was waiting. The published data does not separate the two.
The exact public cost cannot be disaggregated from the Home Office and Ministry of Justice budgets without further work. The Home Office Annual Report and Accounts puts asylum support, resettlement and accommodation at £4,513 million in 2024-25 and £4,181 million in 2025-26, a portion of which is attributable to the appeals-pipeline wait.
Which framing fits the data
Two interpretations are consistent with the same numbers.
The first is the framing that activist tribunals are overruling Home Office decisions and granting protection to people who do not qualify under the original interpretation of the rules. Under this reading, the Tribunal Service should be reformed to align with Home Office decision-making.
The second is the framing that the Home Office decision-making system is wrong roughly half the time on these cohorts, and is costing the taxpayer the difference. Under this reading, the Home Office should make better decisions.
Both framings can be defended. Both have the same Asy_D04 data underneath. The dataset to read for either argument is Home Office Asy_D04 Outcome Analysis, year ending March 2026 release, published 21 May 2026, available at the GOV.UK Immigration System Statistics data tables page.
How to read the figures
Asy_D04 tracks every cohort of asylum claims by year of claim, then tracks each cohort through initial decision, appeal, and any subsequent decision. The “true grant rate” used here is calculated as latest grants of protection plus latest grants of other leave, divided by latest grants plus latest refusals, multiplied by 100. The cohort years used here are 2015 to 2023, the period where most cases have reached final outcomes.
Nationalities below 50 substantive decisions in the cohort years are excluded as too small to give a reliable rate. That leaves 105 tracked, of which 101 see a rise and 4 see a fall. The +14.6 percentage point headline is the unweighted mean across the 101 that rise. Across all 105 it is +14.0pp, and both are given above so the selection is visible rather than implied.
Correction, 22 August 2026. Two figures in this article were wrong and one that looked wrong was not.
The count was wrong. This article said 70 nationalities; the correct figure is 101 rising out of 105 tracked, on the method set out above.
The initial grant rate column was wrong and could not be reproduced from Asy_D04. It read 31.0 percent for Sri Lanka against 26.9 percent, 37.7 percent for Iraq against 30.9 percent, and 37.7 percent for Vietnam against 49.0 percent, an error in the opposite direction, so it was not one systematic slip. The “after appeals” column was correct on every row and is unchanged. Both columns are now computed the same way from the same dataset, and the uplift column is their difference rather than a separately carried figure.
The +14.6pp average was correct and is restored. An intermediate version of this page, live for about an hour on 22 August, restated it as +14.0pp. That was our error, not the original’s: +14.6pp is the mean across the nationalities whose rate rises, and it reproduces from Asy_D04 to the decimal. The same construction reproduces the +14.1pp published in April from the December 2025 release. What the article had never done was say which nationalities the average covered, and the absence of that definition is what made a correct figure look unreproducible.
Sources
- Home Office Immigration System Statistics, year ending March 2026 release (21 May 2026), Asy_D04 Outcome Analysis of asylum claims dataset
- Home Office Asy_D02 Initial Decisions on asylum claims dataset, same release
- Home Office annual report and accounts 2024 to 2025, asylum support spending lines
- First-Tier Tribunal (Immigration and Asylum Chamber) statistics published by the Ministry of Justice
Share this finding. Right-click to save the image.