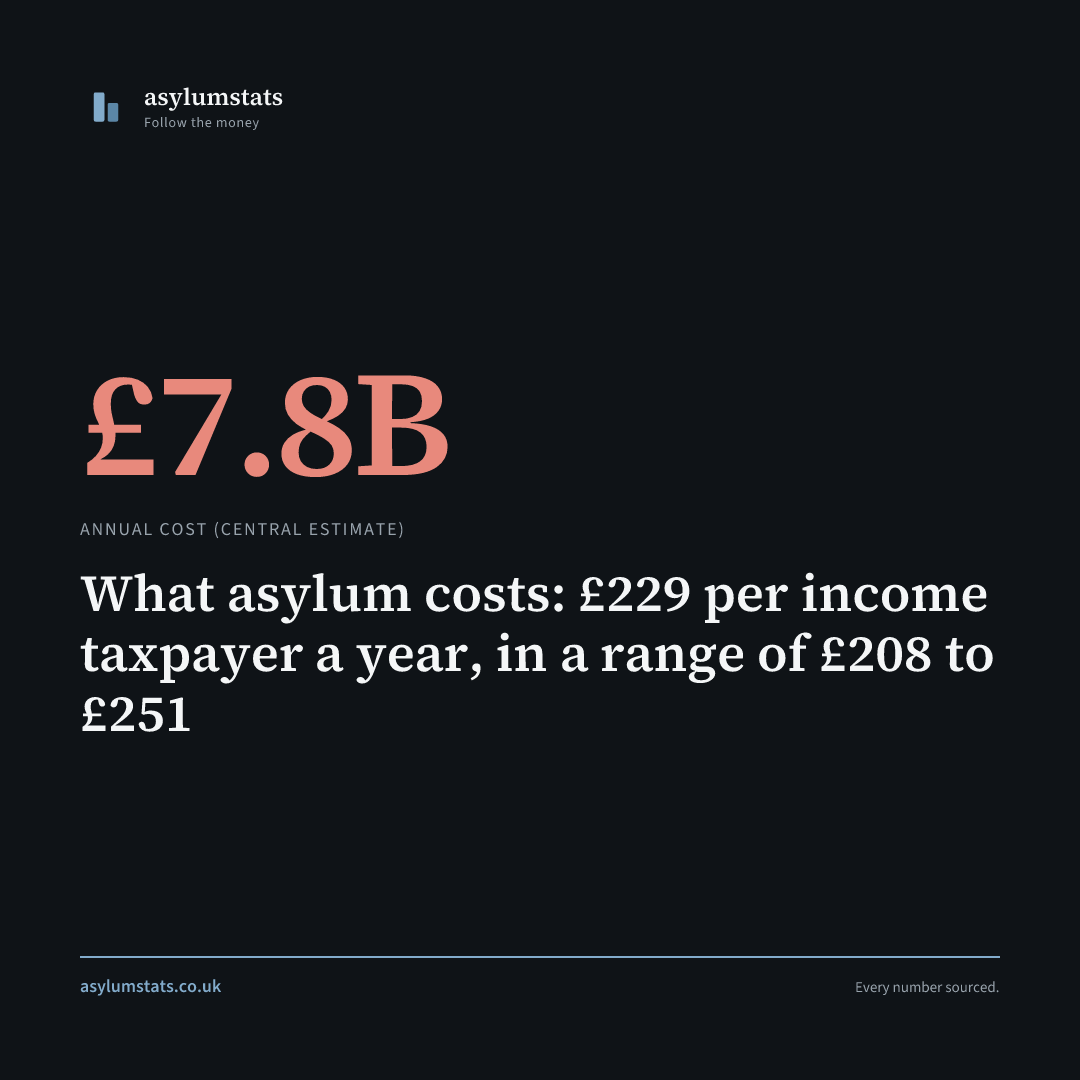
What asylum costs: £229 per income taxpayer a year, in a range of £208 to £251
Correction, 12 October 2026. This was headlined “What asylum costs: £234 per income taxpayer a year, in a range of £212 to £257”, on a central total of £8.0 billion (£7,973M; range £7,225M to £8,773M). That total included a criminal justice line of £152M (range £127M to £203M): a share of foreign national offender prison costs, attributed to the asylum system from nationality overlap. It is removed, because attributing offending by nationality is a link the data cannot support and this site does not publish. Without it the central total is £7.8 billion (£7,821M; range £7,098M to £8,570M), and the cost per income taxpayer is £229, in a range of £208 to £251, not £234 in a range of £212 to £257. The audited share rises from 55% to 56%, the audited or attributed share from 63% to 64%, and the average-attributed part of the total falls from £1,014M to £862M. The calculation now has 14 categories, not 15. Every other line is unchanged.
Correction, 27 September 2026. This was headlined “The true cost of asylum” and is not that. The central figure sits in a defensible range £1.6 billion wide, and 8% of the total is attributed from an audited total rather than measured directly, so what the piece produces is a comprehensive central estimate and the headline claimed a settled number. “True” also invited the counterfactual reading the article itself rejects further down: this is what the system costs divided by taxpayers, not a sum that would be saved. The headline now carries the range. No figure has changed, and the URL is unchanged so existing links still work.
Third edition, 13 August 2026. Rebuilt on the Home Office Annual Report and Accounts 2025-26 (HC 440), published 14 July 2026, which this site did not previously use. The departmental costs are now audited outturn rather than our estimates. The central total moves from £8.05 billion to £7.97 billion, and £236 per taxpayer to £234.
The second edition’s figures were not wrong so much as unverifiable: they estimated from NAO reports and factsheets what the accounts now state directly. Where the two disagree, the accounts win.
£4,181 million. That is what the Home Office spent on asylum support, resettlement and accommodation in the year to March 2026, signed off by the Comptroller and Auditor General. It is the single biggest number in the asylum system, it is down from £4,513 million the year before, and it is roughly half the true bill.
The total annual cost of the UK asylum system is around £7.8 billion, or £229 per income taxpayer. The defensible range is £7.1 billion to £8.6 billion, and the width of that range is itself the finding: 56% of the total is an audited outturn, a further 8% is attributed from an audited total, and the 34% that is estimated is estimated because no government body publishes it.
No official body publishes the complete total. The Home Office publishes its own accounts. The NAO publishes accommodation contracts. The MoJ publishes legal aid. The DWP publishes benefit payments. Nobody adds them all up. So we did, and we show which parts are audited and which are not.
What is audited and what is not
This matters more than the headline figure, so it comes first.
| Basis | What it means | Of the central total | Share |
|---|---|---|---|
| Audited | An outturn line in the Home Office accounts, examined by the National Audit Office | £4,363M | 56% |
| Attributed | An audited total multiplied by a stated asylum share, because the directorate does more than asylum | £657M | 8% |
| Published | Another body publishes it, but not as an asylum-specific total | £175M | 2% |
| Estimated | Our estimate, with the method shown below | £2,626M | 34% |
Every figure in the first two rows can be traced to a page of HC 440. The fourth row cannot, and the reason is the same in each case: the department that incurs the cost does not record it by immigration status.
Attribution, not counterfactual
The figure answers “what share of public spending is associated with the asylum system”. It does not answer “what would the exchequer save if the asylum system stopped”, and the gap between those two questions is worth about £0.9 billion.
| Kind | What it means | Of the central total | Share |
|---|---|---|---|
| Direct | Incurred because of this caseload and scaling with it: accommodation contracts, tribunal sitting days, ESOL places | £6,035M | 77% |
| Transfer | A payment to a person. Marginal equals average by construction, because a pound paid is a pound | £924M | 12% |
| Average attribution | An average cost per head of a wider population, applied to this one | £862M | 11% |
The last row is the one that needs saying. Healthcare takes NHS spend per capita. Education takes funding per pupil. Family reunion takes an estimated £26,500 of public services per person. Each of those averages carries a share of fixed capacity with it: the hospital estate, school buildings.
Fixed capacity does not fall away in proportion to the population using it. So for that £0.9 billion the average overstates what would actually stop being spent, least for education, where per-pupil funding is close to the mechanism by which money actually follows a child.
This is not a hidden thumb on the scale in one direction. The £7.8 billion also excludes whole categories set out below, which pushes the other way. But the two questions have different answers and this article answers the first one. A reader who wants the second should treat roughly £0.9 billion of the total as an upper bound on its own contribution.
Two things this calculation deliberately does not do
It does not add expense types to budget segments. The accounts report “asylum costs excluding grants” of £2,962 million and “detention costs” of £159 million. Those are expense types spread across the department. They sit inside the budget segments counted below. Adding both would count the same money twice, which is the most common way a total like this goes wrong.
It does not apply the system total to a local population. The £7.8 billion includes post-decision welfare and family reunion costs, which are incurred for people who are not on asylum support. Dividing it by the 97,519 people on support and calling the result a per-person cost overstates what an area actually costs by roughly twice. Where this site shows a per-area figure, it uses the accommodation and support cost of £107 per supported person per day, which has the same people in the numerator and the denominator, measured over the same financial year: the audited 2025-26 ASRA outturn over the 106,719 mean supported population of 2025-26. Dividing by the closing quarter alone would read £117, because supported numbers fell through the year and 31 March 2026 is its lowest point.
The full breakdown
Asylum support, resettlement and accommodation: £4,181 million (audited)
The biggest single cost, and as of this edition an audited one. It is the resource outturn for the Home Office business group of that name, and it covers contracted accommodation, subsistence payments, the resettlement schemes, and the grants paid to local authorities. In the previous edition those were three separately estimated lines totalling about £3,970 million; the accounts put the real figure at £4,181 million.
It is falling, and fast:
| Year | ASRA resource outturn |
|---|---|
| 2023-24 | £5,425M |
| 2024-25 | £4,513M |
| 2025-26 | £4,181M |
That is a fall of 23% in two years. The department’s own forward plans continue the trajectory: £4,116M in 2026-27, £3,796M in 2027-28 and £3,622M in 2028-29, under the segment’s new name of Asylum Group. Against budget, the group underspent by £150 million, which the accounts attribute mainly to Afghan resettlement arrivals running below assumption. Home Office costs for Afghan resettlement were £222.1 million, up from £205 million.
Within this, three private companies run every asylum hotel, dispersal house, and reception centre in the country under 10-year AASC contracts:
| Contractor | Region | Contract value (10-year) |
|---|---|---|
| Clearsprings Ready Homes | South England & Wales | £7.3 billion |
| Serco | Midlands, East, North West | £5.5 billion |
| Mears | North East, Yorkshire, Scotland, NI | £2.5 billion |
| Total | £15.3 billion |
The original forecast was £4.5 billion. It has more than tripled.
- Hotels: £2.1 billion, housing 30,657 people at the end of December 2025 (a figure the accounts confirm, down 19% on 2024 and 45% below the September 2023 peak of 56,018). That implies roughly £190 per person per night. The Migration Observatory independently estimates about £170 per night for 2024/25. A previous edition of this article stated £119 per night; we can no longer source that figure and have withdrawn it.
- Dispersal accommodation: approximately £500 million (68,538 people). Cost: approximately £27 per person per day. That is six times cheaper than hotels.
- Initial and contingency accommodation: approximately £100 million.
Hotels house 29% of the asylum population and took 76% of the cost of the accommodation contracts in the first seven months of 2024-25, £1.3 billion of an estimated £1.7 billion (NAO HC 874, as corrected on 1 July 2025).
Performance deductions from contractors since 2019: just £4 million. The total contract value is £15.3 billion.
Source: Home Office Annual Report and Accounts 2025-26 (HC 440), Statement of Outturn against Estimate. Contract values: NAO, “The Home Office’s asylum accommodation contracts,” May 2025.
Border Security Command: £182 million (audited)
Stood up in July 2024 and counted here in full, because unlike Border Force it exists specifically to tackle small boats and organised immigration crime. Its audited outturn rose from £41 million in 2024-25 to £182 million in 2025-26, and its budget is planned to reach £797 million in 2026-27.
The command’s first annual report, published 16 July 2026, records 3,766 disruptions of organised immigration crime in the year to March 2026 against 2,578 the year before, and at least 1,900 arrests against at least 1,100. Those are official statistics in development, not designated official statistics, and the July release revised the earlier figures down.
Source: Home Office Annual Report and Accounts 2025-26. Border Security Commander’s Annual Report: Data, July 2026.
Immigration enforcement, asylum share: £385 million (attributed)
Immigration Enforcement’s audited outturn was £770 million, down from £819 million. Enforcement covers all immigration offending, not only asylum, so this counts 40% to 60% of it with a central case of 50%. That is the same basis the previous edition used, now applied to an audited total rather than an estimated one.
Detention costs sit inside this segment and are not added to it. They are worth stating separately because they are the one asylum cost line moving the wrong way: £159.3 million in 2025-26 against £131.3 million in 2024-25, a rise of 21.3%, in a year when every other major line fell.
An enforced removal costs £48,800 per person. A voluntary return costs £4,300.
Source: Home Office Annual Report and Accounts 2025-26, Statement of Outturn against Estimate and Note 3, Purchase of goods and services.
Border Force, asylum share: £272 million (attributed)
Border Force’s audited outturn was £1,359 million. It protects all UK borders, including trade and drugs, so most of that is not asylum. This counts 15% to 25%, central case 20%. This is a judgement and a debatable one; a narrower reading of what counts as asylum-attributable would put it lower.
Source: Home Office Annual Report and Accounts 2025-26.
Healthcare (NHS): estimated £200-300 million
Asylum seekers are entitled to free GP registration, hospital treatment, mental health services, maternity care, and prescriptions. They are exempt from the Immigration Health Surcharge (IHS), which other visa holders pay at £1,035 per year (£470 for students). The IHS raised £1.7 billion in 2023-24 and £6.9 billion cumulatively since 2015.
No government body publishes asylum-specific NHS costs. This is the biggest data gap in the entire calculation.
Our estimate: the average NHS cost per capita in England is £3,462 per year (House of Commons Library). The population figure below is the 107,003 on support at 31 December 2025; the mean across the whole financial year is 106,719, a difference of 0.3 per cent and far inside the range this estimate carries. The asylum population is younger and healthier on average than the general population (59% are single adult males, predominantly aged 18-40). We estimate asylum seekers use approximately 55-65% of per-capita NHS resources, reflecting lower secondary care usage but higher demand for mental health and maternity services.
- Conservative estimate: 107,003 x £3,462 x 0.55 = £204 million
- Central estimate: 107,003 x £3,462 x 0.60 = £222 million
- Upper estimate: 107,003 x £3,462 x 0.70 = £259 million
We use £222 million as the central figure. This could be materially wrong in either direction. Proper data would require NHS Digital to publish asylum-specific cost data, which it currently does not.
Education: estimated £120-180 million
Approximately 15,000-25,000 children of asylum-seeking families attend UK schools. Neither the Home Office nor the DfE publishes this number. We estimate from the 46,824 people in family groups (13,986 families), of whom roughly 50-55% are likely to be children based on typical family composition.
Per-pupil funding averages £6,000 per year (DfE National Funding Formula). English as an Additional Language support adds £595-£1,595 per child for the first three years.
- Conservative estimate (15,000 children): £105 million
- Central estimate (20,000 children + EAL): £140 million
- Upper estimate (25,000 children + EAL + SEND): £185 million
We use £140 million as the central figure. As with healthcare, the true number is unknown because the government does not publish asylum-specific education data.
Tribunals and courts: approximately £115 million
The Immigration and Asylum Chamber of the First-tier Tribunal costs £79.5 million per year to run. At 30 June 2026 it had 155,798 open cases, 90,341 of them asylum and protection appeals, and an asylum and protection appeal took a mean of 72 weeks to clear in April to June 2026.
The Home Office spends a further £22 million per year on its own appeal representation. Upper Tribunal and judicial review costs add an estimated £10-15 million (not separately published by HMCTS).
Source: MOJ Tribunal Statistics Quarterly, April to June 2026 (caseload and clearance time); NAO December 2025 (running and representation costs).
Legal aid: approximately £60 million
Immigration is the largest non-family category of civil legal aid. The Legal Aid Agency spent £51 million on immigration and asylum cases in 2023-24. The 2024-25 figure is not yet published but quarterly returns suggest approximately £60 million.
A 30% fee increase for controlled legal aid work took effect on 4 July 2025. It was the first increase since 1996. London rates rose from £52.65/hour to £69.30/hour. This was forced by judicial review (Duncan Lewis Solicitors v LAA). The increase is projected to add £20 million per year to the legal aid bill.
More than half of people seeking asylum or appealing a refusal at the First-tier Tribunal were unable to secure legal aid representation in 2023-24. This has created provider deserts in parts of the country.
Legal aid for asylum appeals specifically rose 56% to £6.2 million in 2024-25.
Source: Legal Aid Agency Annual Report 2023-24. Duncan Lewis confirmation of 30% fee increase (July 2025). NAO December 2025.
Post-decision welfare costs: approximately £924 million
Approximately 55,000 people are granted refugee status or humanitarian protection each year. Each enters the mainstream welfare system immediately. The average Universal Credit payment is £9,000 per year. Housing benefit (Local Housing Allowance) averages £7,800 per year. Child benefit, council tax support, and other entitlements add further costs.
- Conservative estimate (50,000 grants × £14,800 avg): £740 million
- Central estimate (55,000 grants × £16,800 avg): £924 million
- Upper estimate (60,000 grants × £18,300 avg): £1,098 million
This is the annual cost of one year’s cohort entering the welfare system. The cumulative cost of all refugees granted status in the past 5 years is approximately £4.6 billion per year. We count only one year’s intake to avoid double-counting with historic cohorts.
The 28-day move-on period (when asylum support ends after a positive decision) creates an immediate homelessness crisis. In 2024-25, 19,310 newly recognised refugees were homeless or at risk of homelessness. That is up from 3,560 in 2021-22, a 442% increase. A pilot extending the period to 56 days found that less than half of refugees secured housing even with the extra time.
Source: Home Office asylum outcomes data (year ending December 2025). DWP benefit expenditure tables. House of Commons Library SN01909. Inside Housing, refugee homelessness data 2025.
Family reunion dependants: approximately £500 million
18,869 people entered the UK on family reunion visas in 2025. That is up 360% from 4,113 in 2022. Each person immediately enters the welfare and public service system (housing, benefits, school places for children, NHS).
We estimate an average annual public service cost of £26,500 per person (housing benefit + UC + education for children + NHS). This is lower than the per-refugee figure because family reunion includes working-age adults who may find employment within 12-18 months.
- Conservative estimate (18,869 × £20,000): £377 million
- Central estimate (18,869 × £26,500): £500 million
- Upper estimate (18,869 × £33,000): £623 million
Source: Home Office immigration statistics, year ending December 2025. DWP benefit expenditure analysis.
ESOL and integration: approximately £250 million
Refugees and people granted protection need English language support, employment programmes, and integration services. ESOL (English for Speakers of Other Languages) funding has been cut by 60% since 2009, but the remaining provision costs approximately £200 million nationally through the Adult Education Budget.
Additional refugee-specific integration programmes (DLUHC integration funding, local authority resettlement support, employment coaching) cost approximately £50 million.
Source: House of Commons Library, English Language Teaching for Refugees (CDP-2017-0195). DLUHC integration programme data.
Translation and interpreting: approximately £125 million
Every asylum interview, tribunal hearing, GP appointment, hospital visit, and council interaction requires professional interpreting for non-English speakers. The NHS spends approximately £60 million per year on language services. HMCTS interpreter costs add approximately £25 million. Local authority translation services and police interpreting add a further £40 million.
No single source publishes the total. This figure is constructed from published sectoral estimates.
Source: NHS Digital language services data. HMCTS Annual Report. Local Government Association survey data.
NRM / Modern slavery support: approximately £340 million
17,004 potential victims were referred to the National Referral Mechanism in 2024. The Salvation Army holds the prime contract for safe house accommodation and victim support. Each referral receives a minimum 45-day recovery period with accommodation, subsistence, legal advice, and caseworker support. The cost is approximately £20,000 per referral.
There is significant overlap between NRM referrals and the asylum system. Approximately 60% of NRM referrals also have an asylum claim. We attribute the full NRM cost here because the modern slavery support system exists primarily to serve people who entered the UK irregularly.
- Conservative estimate (17,004 × £15,000): £255 million
- Central estimate (17,004 × £20,000): £340 million
- Upper estimate (17,004 × £25,000): £425 million
Source: Home Office, National Referral Mechanism Statistics (year ending December 2024). Salvation Army Modern Slavery Victim Care Contract.
Local authority unfunded costs: approximately £125 million
The grants councils receive from the Home Office are already counted inside ASRA above. What is not counted there is the gap between those grants and what the services actually cost.
Failed asylum seekers with no recourse to public funds cost local authorities £55-65 million per year (NRPF Network). Leaving-care support for former unaccompanied children adds an estimated £50-80 million. The NAO noted in December 2025 that asylum costs for councils are “poorly understood” and that the £1,200 per asylum seeker dispersal grant falls well short of actual service costs.
- Conservative estimate: £105 million
- Central estimate: £125 million
- Upper estimate: £145 million
This is the least well evidenced line in the calculation and is probably understated, because no council publishes a full asylum cost centre.
Source: NRPF Network local authority cost data. NAO, “An analysis of the asylum system,” December 2025.
The total
Categories are ordered by central value. The basis column is the point of the table: it says which figures a reader can check against an audited account and which rest on our method.
| Component | Basis | Conservative | Central | Upper |
|---|---|---|---|---|
| Asylum support, resettlement and accommodation | Audited | £4,181M | £4,181M | £4,181M |
| Post-decision welfare | Estimated | £740M | £924M | £1,098M |
| Family reunion dependants | Estimated | £377M | £500M | £623M |
| Immigration enforcement, asylum share | Attributed | £308M | £385M | £462M |
| Modern slavery support | Estimated | £255M | £340M | £425M |
| Border Force, asylum share | Attributed | £204M | £272M | £340M |
| ESOL and integration | Estimated | £200M | £250M | £300M |
| Healthcare | Estimated | £204M | £222M | £259M |
| Border Security Command | Audited | £182M | £182M | £182M |
| Education | Estimated | £105M | £140M | £185M |
| Translation and interpreting | Estimated | £80M | £125M | £170M |
| Local authority unfunded costs | Estimated | £105M | £125M | £145M |
| Tribunals and courts | Published | £102M | £115M | £130M |
| Legal aid | Published | £55M | £60M | £70M |
| Total | £7,098M | £7,821M | £8,570M |
The conservative column uses the lowest defensible assumption in each estimated category and the lowest attribution share. The upper column uses the highest. The audited rows do not vary, which is why the range narrowed against the previous edition: more of the total is now a fact rather than a judgement.
The audited rebuild landed within 1% of the estimate-built one. The second edition put the central total at £8,050M by estimating the departmental costs; the accounts put the same block at a figure that produced £7,973M. That agreement is worth stating because it is the closest thing to a check available on a number nobody else calculates. Both figures included the criminal justice line removed on 12 October 2026; without it the central total is £7,821M.
YOUR bill
| Conservative | Central | Upper | |
|---|---|---|---|
| Annual cost | £7.1 billion | £7.8 billion | £8.6 billion |
| Per income taxpayer | £208 | £229 | £251 |
| Per household | £255 | £281 | £308 |
| Per day nationally | £19.4M | £21.4M | £23.5M |
The central estimate is £229 per income taxpayer per year, on a range of £208 to £251. Taxpayers: 34.1 million, HMRC projected 2024-25. Households: 27.8 million, ONS.
56% of that is an audited outturn, and 64% is either audited or attributed from an audited total. The remainder is estimated because the departments that incur it, principally DWP, NHS and DfE, do not record spending by immigration status. If any of them published asylum-specific figures, this article would be shorter and its range narrower.
What this does NOT include
This calculation covers 14 cost categories and still deliberately excludes costs we cannot reasonably estimate:
- Cumulative welfare liability: We count one year’s intake (55,000 grants). The cumulative cost of all cohorts still receiving welfare is far higher. Counting it would require assumptions about employment rates and benefit duration that vary enormously by nationality and year of arrival.
- Economic opportunity cost: Asylum seekers are prohibited from working for at least 12 months. The lost economic output and tax revenue are real but difficult to quantify.
- Housing market displacement: Dispersal of asylum seekers into areas with tight housing stock increases rents and reduces availability for local residents. No published estimate exists.
- The £715 million spent on the now-scrapped Rwanda scheme: A sunk cost, not an annual liability.
- Social cohesion costs: Policing community tensions, far-right activity, counter-extremism programmes in dispersal areas.
- Most local government unfunded costs: only the two quantifiable parts are counted above. The £1,200 per asylum seeker dispersal grant falls far short of actual service costs and no council publishes the difference.
The lifetime fiscal impact
Each annual cohort of 55,000 grants creates a long-term fiscal liability. Using the Migration Observatory’s central estimate of £1,700 per year net fiscal cost for non-EEA migrants (static model), a single cohort costs approximately £93.5 million per year for as long as they remain in the UK.
Over a 30-year horizon, one year’s cohort of 55,000 grants creates a cumulative fiscal liability of approximately £2.8 billion (undiscounted). Five years of grants at current rates = £14 billion in lifetime fiscal cost.
These figures use the static fiscal model. The dynamic model (which accounts for children’s future contributions) gives a more favourable picture: the Oxford Economics estimate suggests a £28,000 net benefit per migrant over a full lifetime. Which model you believe depends on assumptions about employment rates, fertility, and integration that are beyond the scope of this analysis.
Source: Migration Observatory, “The Fiscal Impact of Immigration in the UK” (2024). Oxford Economics, “The Fiscal Impact of Immigration on the UK” (2018). OBR, “Impact of Migration on the Fiscal Forecast.”
Correction, 12 October 2026. A section headed “Foreign National Offenders: the data that exists” is withdrawn. It set the prison population by nationality against the nationalities most common among people claiming asylum, and cited research on asylum dispersal and crime. That implied a link between nationality and crime which the data cannot support: prison statistics by nationality say nothing about whether anyone claimed asylum, and this site does not publish claims of that kind. A sentence in the criminal justice cost line above, which named nationalities in the same way, is removed for the same reason. No cost figure on this page changes.
Demographic projections for all 320 local authorities (including ethnic composition, religion, and nativity) are published on UK Demographics.
The aid budget
£2.8 billion of the asylum bill is classified as Official Development Assistance (ODA). This means a fifth of the UK’s total overseas aid spending (approximately £14 billion in 2024) goes to housing asylum seekers domestically, not to development work abroad.
Source: Statistics on International Development, provisional UK ODA spend 2024.
Methodology and limitations
Every component uses the most recent published figure available. Where no published figure exists (healthcare, education), we show the estimation method and provide conservative, central, and upper estimates. Two components (healthcare and education) rely entirely on estimates because the government does not publish asylum-specific costs in these areas.
Two figures rest on an attribution judgement rather than a measurement: what share of Immigration Enforcement (40-60%, central 50%) and of Border Force (15-25%, central 20%) is asylum-attributable. Both directorates do substantially more than asylum. These are the numbers to argue with first, and moving them moves the total by several hundred million.
The audited lines carry no such judgement. They are the outturn the Home Office reported and the National Audit Office examined, and they can be checked against HC 440 directly.
All source documents are listed below and linked where available online. We welcome correction. If any figure in this article is wrong, contact us and we will update it.
Sources
Core government sources:
- Home Office Annual Report and Accounts 2025-26 (HC 440), published 14 July 2026: Statement of Outturn against Estimate, and Note 3 Purchase of goods and services
- Border Security Commander’s Annual Report: Data, 16 July 2026
- NAO, “An analysis of the asylum system,” December 2025
- NAO, “The Home Office’s asylum accommodation contracts,” May 2025
- NAO, Home Office Overview 2024-25, October 2025
- Home Office Immigration Statistics, year ending December 2025
- Home Office asylum accommodation factsheet, June 2025
- Home Office Asylum Grant Funding Instruction 2025-26
- Home Office UASC Funding Instructions 2025-26
- Home Office Afghan Resettlement Programme FY 2025-26
- Home Office, “Average cost of an Immigration Enforcement return FY 2024 to 2025”
- Home Office National Referral Mechanism Statistics 2024
- Home Office Review of Weekly Allowances 2023
Legal and financial:
- Legal Aid Agency Annual Report 2023-24
- Duncan Lewis Solicitors, 30% fee increase confirmation, July 2025
- HMCTS Tribunal Statistics Quarterly 2025
- House of Commons Library briefings SN01909, CBP-9681, SN00724, CBP-7274
- Statistics on International Development, provisional UK ODA spend 2024
- IFS, Home Office budgeting analysis, August 2024
Local authority and welfare:
- GOV.UK Homes for Ukraine guidance (tariffs, education, host payments)
- NRPF Network local authority cost data
- DfE National Funding Formula 2024-25
- DWP benefit expenditure tables
- DLUHC integration programme data
- Inside Housing, “350% Increase in Refugee Homelessness,” 2025
Academic and analysis:
- Migration Observatory, “The Fiscal Impact of Immigration in the UK,” 2024
- Oxford Economics, “The Fiscal Impact of Immigration on the UK,” 2018
- OBR, “Impact of Migration on the Fiscal Forecast”
- University of York / University of Liverpool, border security contracts research, April 2025
- Detention Action briefing paper, October 2024
- Salvation Army Modern Slavery Victim Care Contract
Around £7.8 billion. £229 per income taxpayer. Every year. The biggest single component is falling and is now audited; the parts nobody audits are the parts nobody publishes.
Short video summary. Share it on social media.
Share this finding. Right-click to save the image.