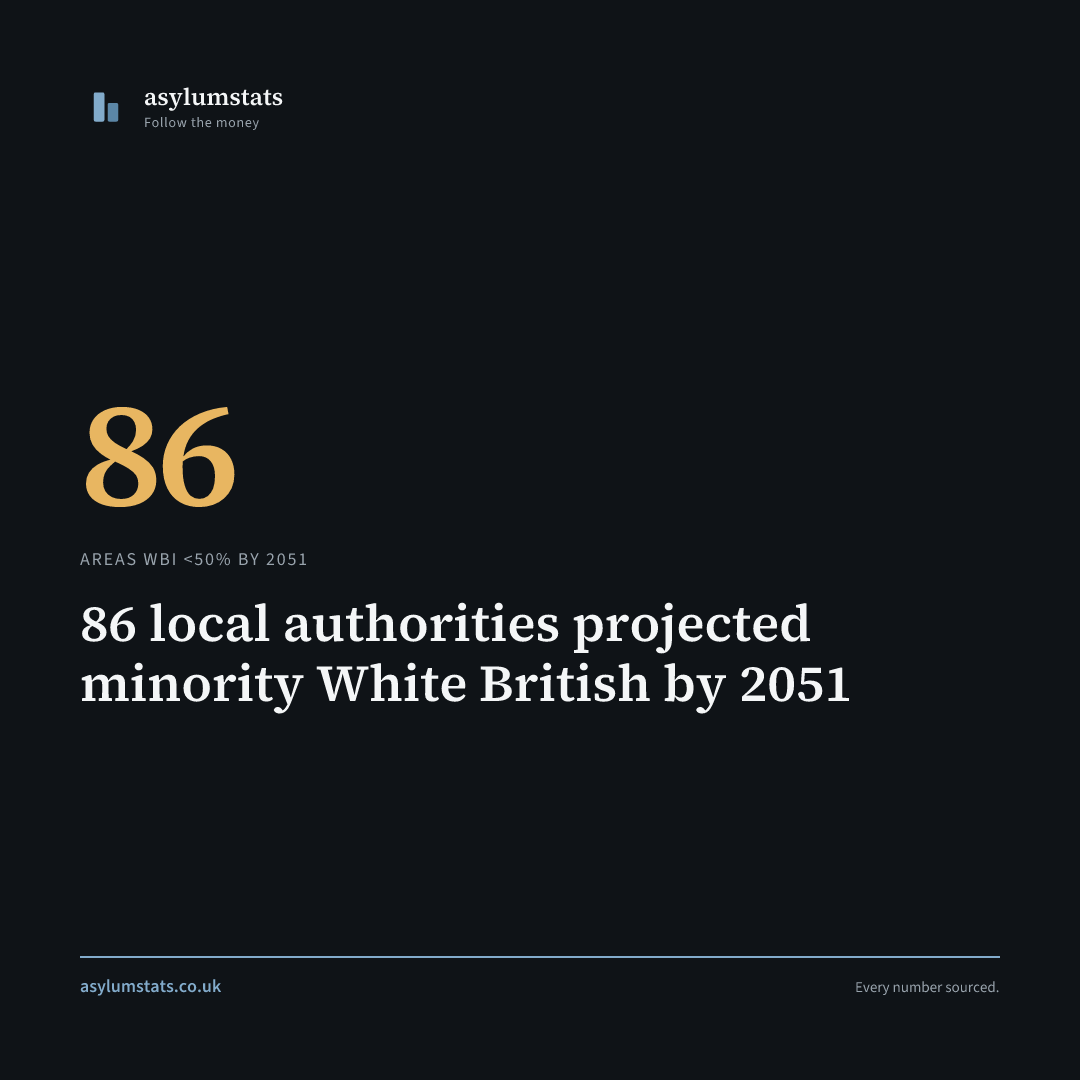
86 local authorities projected minority White British by 2051
Correction, 12 October 2026. This piece said the White British share across the 318 authorities, weighted by their 2021 populations, is 55.0% by 2051. It is 55.1% (55.13%). Two things changed it. Barnsley and Sheffield were being read from records left over from an older model run, filed under their old area codes; they now come from the current records, which moves Barnsley’s 2051 projection from 62.9% to 80.8% and Sheffield’s from 47.8% to 46.7%. And the previous figure, 55.06%, had been cut to 55.0% rather than rounded to 55.1%. The projection file is now an exact copy of UK Demographics’ file. The 2021 share, 74.4%, and the count of 86 do not change.
Correction, 12 October 2026. This piece said 15 areas whose projections diverge are left out of the count of 86. The plausibility guard withholds 2051 for six areas below 50%: Barnet, Hackney, Lambeth, Enfield, Haringey and Islington. Counting them would give 92, which is why the published count is 86.
The cohort-component model was said to give 54.6% on the same weighting, and the two models to agree to within half a point. That run had read each area’s ONS population projection twice, adding the single years of age to the all-ages total. Re-run without that error and synced from UK Demographics, it gives 53.6% across all 318 authorities, 1.5 points below the Hamilton-Perry 55.1%, so the half-point agreement this piece pointed to no longer holds.
Correction, 13 August 2026. This piece originally said 109 areas and cited the model’s backcast score as validation. Both were wrong. The backcast fitted its ratios on the same two Censuses it was tested against, so it measured the model’s own guardrails rather than its accuracy, and those guardrails were letting projections compound into arithmetic rather than demography.
The model has since been recalibrated against a genuine out-of-sample test that fits on Census 2001 to 2011 and forecasts 2021, scored on the actual Census 2021. That test showed the old settings were projecting change too fast, not too slow as previously stated here. On the recalibrated model the count is 86, and the currently-majority subset is 59, not 76. See the methodology for the test and the numbers.
86 councils. Minority White British by 2051.
67 by 2041. 86 by 2051. These are not forecasts. They are Hamilton-Perry projections extrapolating Census 2011-to-2021 cohort change ratios forward, constrained by ONS population projections. On the out-of-sample test the model is close to unbiased, with a mean error of +0.05 percentage points on the White British share and a mean absolute error of 1.56pp per decade. Read the numbers with that error attached rather than as point estimates.
Of the 86, 59 have a White British majority today. They cross the threshold within a generation.
The ten fastest transformations among current-majority areas:
| Area | WBI 2021 | WBI 2051 | Change |
|---|---|---|---|
| Bolton | 68.8% | 26.9% | -41.9pp |
| Havering | 66.5% | 24.8% | -41.7pp |
| Pendle | 66.1% | 28.7% | -37.4pp |
| Thurrock | 66.2% | 29.3% | -36.8pp |
| Bexley | 64.5% | 28.5% | -36.0pp |
| Broxbourne | 68.6% | 33.1% | -35.5pp |
| Oldham | 65.2% | 29.9% | -35.3pp |
| Sandwell | 52.1% | 17.8% | -34.3pp |
| Dartford | 67.3% | 33.1% | -34.2pp |
| Sutton | 57.3% | 24.2% | -33.1pp |
Bolton. 68.8% White British today. Projected 26.9% by 2051. That is a 42 percentage point decline in 30 years.
This is not a London story. Bolton, Pendle, Oldham, Thurrock, Broxbourne, Sandwell, Dartford. Towns across England.
Already below 50% in 2021 (33 areas): Birmingham (42.9%), Leicester (33.2%), Luton (31.8%), Slough (24.0%), Newham (14.8%), Brent (15.2%). These areas passed the threshold years ago.
The national picture. England and Wales White British share: 74.4% (Census 2021, ONS TS021). Across the 318 distinct local authorities the model projects, weighted by their 2021 populations, the share is 74.4% in 2021 and 55.1% by 2051. The cohort-component model, which assumes ethnic fertility rates converge partway to the national mean, gives 53.6% on the same weighting, across the 318 authorities that carry a cohort-component figure.
The two models are 1.5 points apart on this weighting, 55.1% against 53.6%. This piece previously said they agreed to within half a point and called that a check on the recalibration; that agreement came from a cohort-component run with an error in it, and it does not hold on the corrected run.
Three things drive it. Fertility: White British TFR 1.31, below replacement. Age structure: the White British population is older, dying faster than it replaces itself. Migration: selective out-migration of White British to surrounding areas, combined with international in-migration to cities.
Why a handful of areas are still missing from this count. Cohort change ratios compound, and with the old growth ceiling of 5.0 a group could quintuple in a decade, which is 625 times over four steps. That produced projections that were arithmetic rather than demographic in 108 areas: Enfield’s “Other” category reached 67% by 2051, Barnsley’s White Other went from 4.3% to 45.3%. The ceiling selected on the out-of-sample test cuts that to six areas whose 2051 is still withheld: Barnet, Hackney, Lambeth, Enfield, Haringey and Islington. Those six do not appear in the 86.
The data is on every place page on this site. Search your area.
Source: Census 2021 custom dataset (20 ethnic groups, direct observations). Hamilton-Perry v8.0 single-year CCR model, Census 2011 DC2101EW base, SNPP 2022-based envelope. Ratios shrunk toward the national ratio by cell size and capped at 1.65 growth per decade, both selected on an out-of-sample test fitting 2001 to 2011 and forecasting 2021 (MAE 1.56pp, bias +0.05pp across 285 areas).
Share this finding. Right-click to save the image.