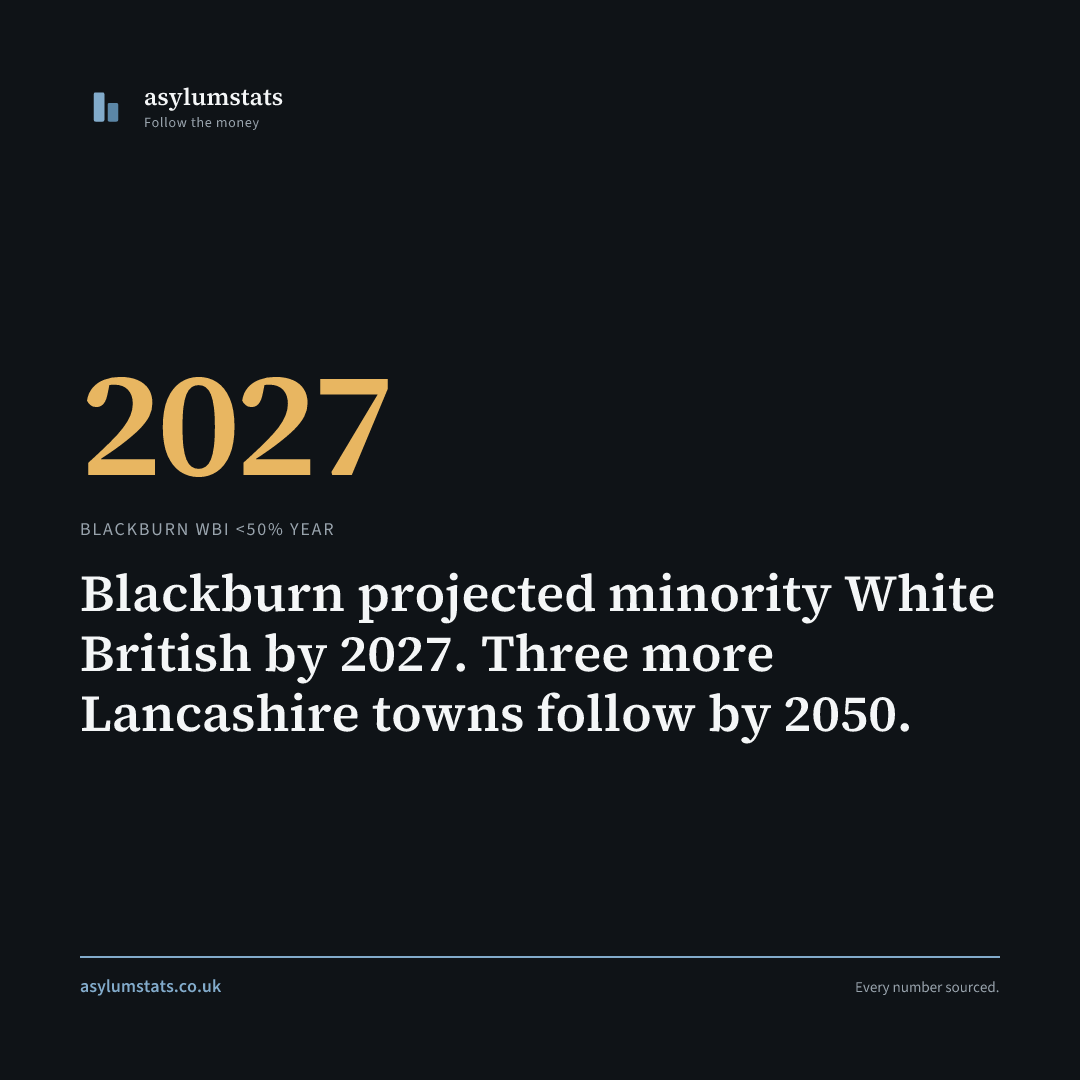
Blackburn projected minority White British by 2027. Three more Lancashire towns follow by 2050.
Correction, 12 October 2026. Blackburn with Darwen’s White British share in 2011 was 66.5% (Census 2011 KS201EW: 98,144 of 147,489 usual residents), not 66.6%. Preston’s asylum figure, 554 people on asylum support, could not be traced to any Home Office quarter: Preston had 429 people on asylum support at 31 December 2025, the quarter Burnley’s 461 comes from, and 407 at 30 June 2026. Burnley had 471 at 30 June 2026 (Home Office, Immigration system statistics, regional and local authority data). Nothing else in the piece changes.
Blackburn. 56.9% White British. The projection crosses 50% in 2027, and the model’s own error puts the crossing between 2026 and 2028.
Census 2021: Blackburn with Darwen, 56.9% White British. Down from 66.5% in 2011. Nearly 10 percentage points gone in one decade.
The Hamilton-Perry model projects, with a mean absolute error of 1.56pp per decade on the White British share and a bias of +0.05pp, which is close to unbiased. The caveat that matters here is the horizon, not the direction: only a one-decade test has been run, so 2031 is the best-evidenced row below and 2051 the least.
| Year | Blackburn WBI |
|---|---|
| 2021 | 56.9% (Census) |
| 2026-2028 | 50% (threshold, interpolated) |
| 2031 | 45.8% |
| 2041 | 34.6% |
| 2051 | 24.6% |
Blackburn is not alone in Lancashire.
Pendle. 66.1% White British (2021). Projected below 50% in 2034, on a range of 2033 to 2035. Nelson and Colne are the concentration points. White British projected 28.7% by 2051.
Preston. 66.1% White British (2021). Projected below 50% in 2037, on a range of 2035 to 2039. University city. International migration pipeline. 429 on asylum support at 31 December 2025, 407 at 30 June 2026. White British projected 35.6% by 2051.
Burnley. 77.9% White British (2021). Projected below 50% in 2050, on a range of 2048 to 2053. 461 on asylum support at 31 December 2025, 471 at 30 June 2026. The Daneshouse and Stoneyholme ward is already majority South Asian.
Four Lancashire mill towns. Same industry. Same deprivation. Same trajectory. Different timelines.
Blackburn gets there first because it started from a lower base (56.9% vs Burnley’s 77.9%) and has a larger established South Asian community driving higher cohort change ratios. The dynamics are identical. Only the speed differs.
Source: Census 2021 custom dataset. Hamilton-Perry v8.0, Census 2011 DC2101EW base, SNPP-constrained, recalibrated on an out-of-sample test (MAE 1.56pp, bias +0.05pp). Threshold years revised on 13 August 2026. Threshold years interpolated linearly from the decadal projections. The range on each is that interpolation re-run with the model’s own mean absolute error of 1.56pp applied to the projected endpoint, widened by the square root of the number of decades. It is a sensitivity band, not a confidence interval: it carries the model’s measured one-decade error forward and nothing else, so it says how much a crossing year moves under that error, not how much it could move in total. A crossing year further out rests on more compounding and is correspondingly weaker, which is why Burnley’s range is five years wide and Blackburn’s is two. The backcast score previously quoted here has been withdrawn; it measured the model’s own guardrails rather than its accuracy. See the methodology.
Share this finding. Right-click to save the image.