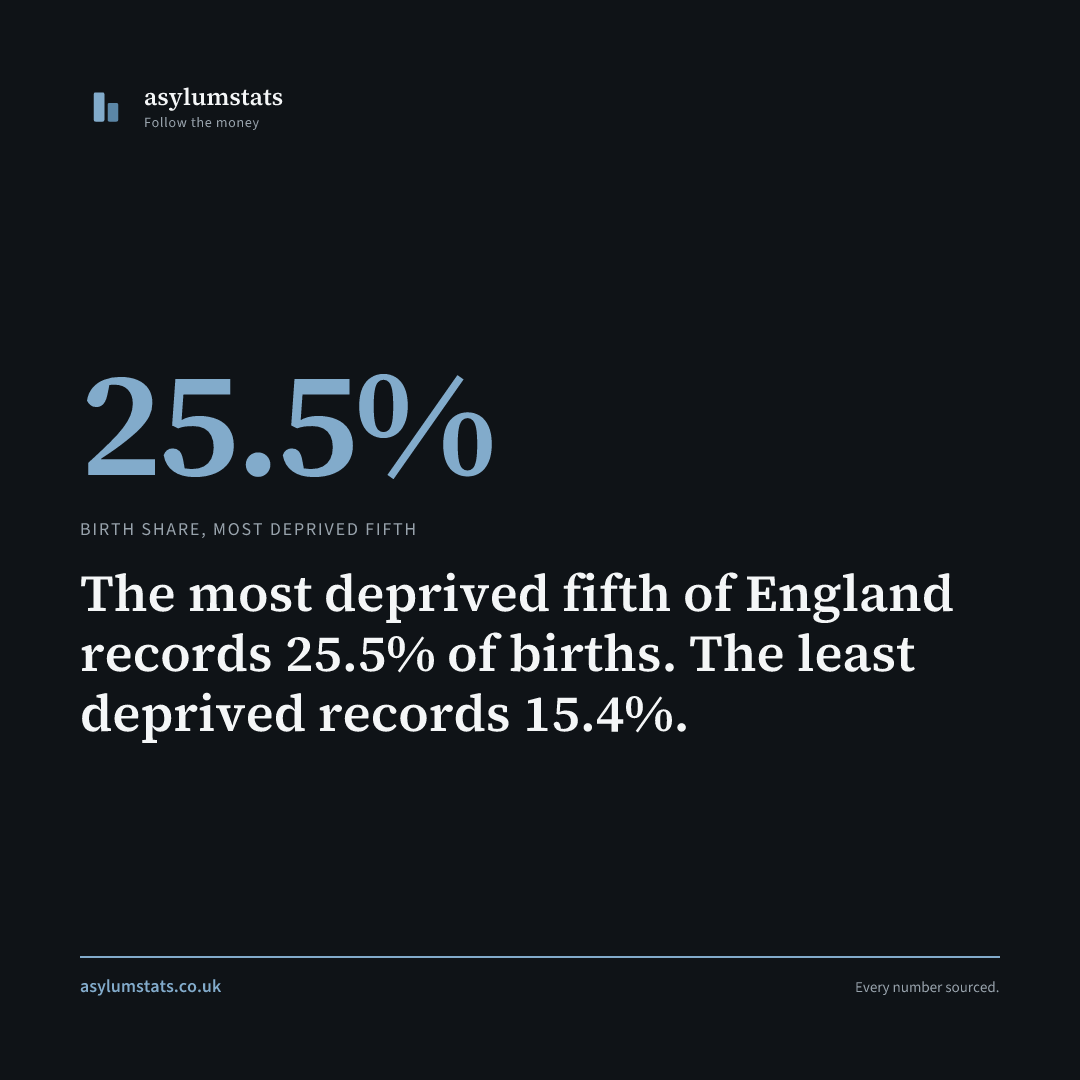
The most deprived fifth of England records 25.5% of births. The least deprived records 15.4%.
Correction, 7 September 2026. This piece was headlined “Women in the most deprived areas have 66% more births. Poverty drives fertility, not just ethnicity,” and gave 1.66x as a fertility ratio. It is not one. The figure is 144,522 births against 87,216, and ONS Table 8 publishes no count of women aged 15-44 per decile to divide either number by. A birth count is not a birth rate without the population at risk underneath it, which is the same rule this site applies to asylum support and did not apply here. The gradient is real and the confounding argument survives; the causal headline and the rate claim do not.
The standard line: ethnic minorities have more children. The data is more complicated. It is also thinner than this page used to claim.
ONS Linked Births 2024. 567,412 births broken down by Index of Multiple Deprivation decile.
Most deprived quintile (Deciles 1-2): 144,522 births. 25.5% of the total.
Least deprived quintile (Deciles 9-10): 87,216 births. 15.4%.
Every step down the deprivation ladder adds births. Decile 1: 75,561. Decile 10: 41,207. The gradient is monotonic across all ten deciles, which is not what noise looks like.
What this is not
It is not a fertility rate, and the difference matters enough to state plainly.
A rate needs a denominator: births divided by the women who could have had them. Table 8 gives births by decile and stops there. It publishes no count of women aged 15-44 per decile, and this site has not obtained one, so no rate by deprivation appears on this page.
That gap is not a technicality. IMD deciles are deciles of small areas, not of women of childbearing age, and deprived areas have younger age structures. Some unknown part of the 25.5% against 15.4% is therefore age composition rather than fertility behaviour. Without the denominator there is no way to say how much, and no honest way to convert the birth share into a statement about what women in those areas do.
What survives
The confounding argument, which was always the point of the page.
Pakistani TFR: 2.52. White British TFR: 1.31. Those are rates, computed against Census 2021 women aged 15-44, and that gap is real.
But Pakistani and Bangladeshi populations are heavily concentrated in the most deprived deciles. Burnley, Blackburn, Bradford. The areas with the fastest ethnic change are also the most deprived areas. Two gradients sit on top of each other, and the published tables give ethnicity, IMD and age only as separate marginals, never crossed.
So the honest statement is the negative one. Anyone attributing the whole fertility differential to ethnicity is asserting something the published data cannot establish, because the deprivation gradient is not held constant. That does not license the reverse claim either. Nothing here shows deprivation causing the difference, and this page no longer says it does.
Separating the two would need ethnic-specific age-specific fertility rates by deprivation decile, which means an ONS ad-hoc request. Until that exists, the projections use Census-derived child-woman ratios per authority per ethnic group and do not use these TFRs as inputs at all.
Peak fertility age: 30-34 (98.0 per 1000 women). Under-20 fertility: 8.1 per 1000. National TFR: 1.50.
Source: ONS Linked Births 2024, Table 8, for births by IMD decile. Census 2021 custom dataset for the ethnic-group TFR denominators, which exist; there is no equivalent denominator by deprivation decile in the published tables. Table 8 provides ethnicity, IMD and age as separate marginals, not a full cross-tabulation.
Share this finding. Right-click to save the image.