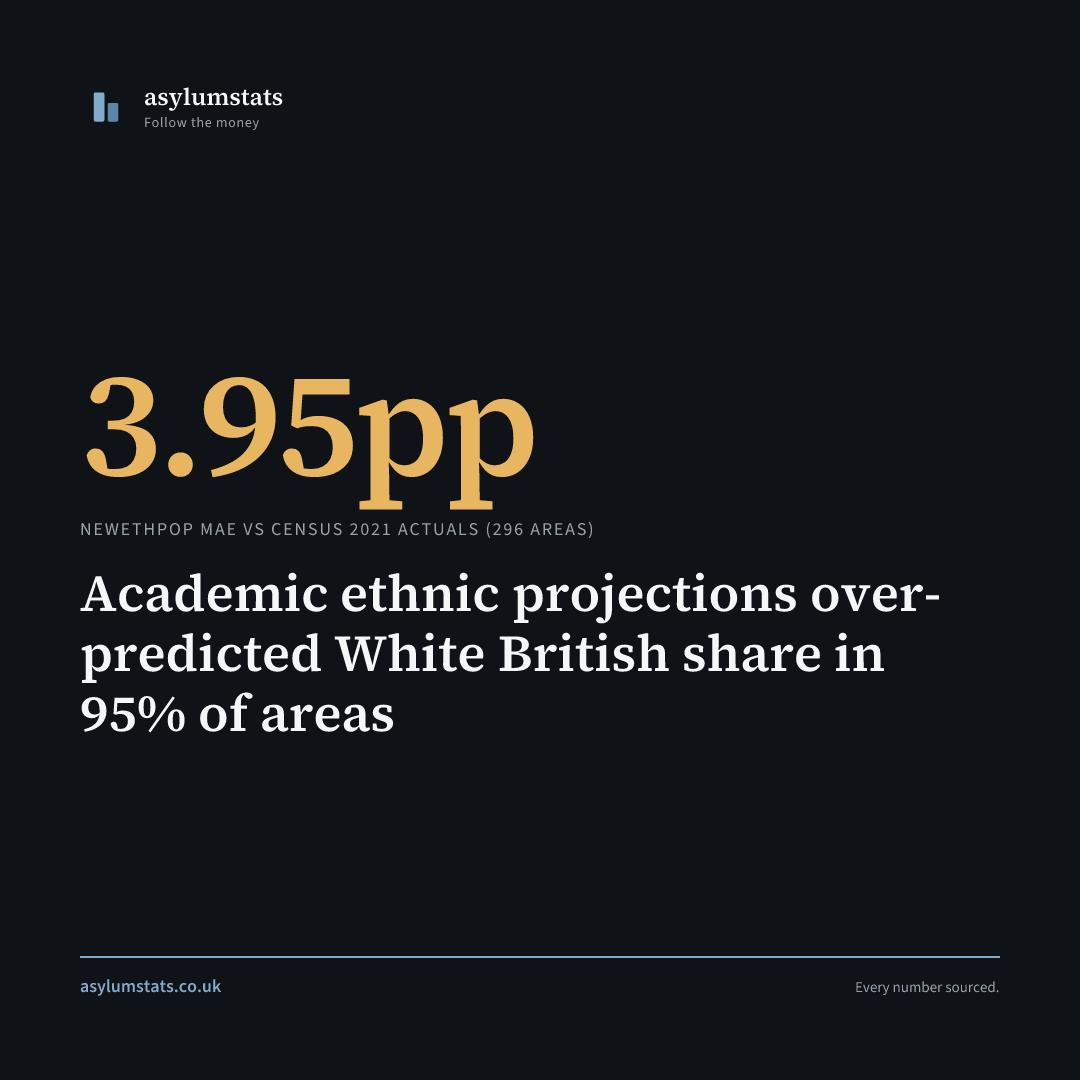
Academic ethnic projections over-predicted White British share in 95% of areas
The UK diversified faster than the best academic model predicted.
NEWETHPOP, the most cited ethnic population projection for UK local authorities, was built by Rees, Norman, Wohland, Lomax and Clark at the University of Leeds. Published via the UK Data Service in 2016 (ESRC grant ES/L013878/1), it projected ethnic composition from Census 2011 to 2061 using a bi-regional cohort-component model with age-specific fertility, mortality, and migration rates by ethnic group. Two scenarios were published: a Brexit variant (Leeds1) and an ONS-aligned variant (Leeds2). The full dataset (2 × 1GB) is freely available under CC BY 4.0.
Census 2021 gave us the answer. We downloaded the Leeds2 (ONS-aligned) archive, extracted the Population2021 prediction for all local authorities, and compared it against actual Census 2021 data from ONS TS021.
Result: the model over-predicted White British population share in 282 out of 296 areas (95%). Mean Absolute Error: 3.95 percentage points. RMSE: 5.21pp. Only 16% of areas were accurate to within 1 percentage point.
The worst misses were systematic, not random:
- Thurrock: predicted 83.4% WBI, actual 66.2%, error of +17.2pp
- Greenwich: predicted 57.4%, actual 41.4%, error of +16.0pp
- Barking & Dagenham: predicted 46.6%, actual 30.9%, error of +15.7pp
- Havering: predicted 82.0%, actual 66.5%, error of +15.5pp
- Bexley: predicted 79.4%, actual 64.5%, error of +15.0pp
All five worst misses are in London and the Thames Gateway, areas where international migration accelerated beyond the model’s assumptions. The model assumed EU and non-EU migration volumes based on pre-2016 patterns. Brexit, the post-2021 visa surge, and the expansion of student and skilled worker routes all changed the composition of migration in ways the 2011-calibrated model could not anticipate.
This is not the first time. The Leeds team themselves acknowledged that their original ETHPOP model (2001-based) had the same systematic bias when validated against Census 2011. NEWETHPOP was funded specifically to correct this. The correction was insufficient. The same directional error persisted, just smaller in magnitude.
The projections built on it inherit the problem.
Ethnic projections for the UK that take their component rates from this tradition, including Goodwin’s CHSS report (2025) projecting White British minority by 2063, inherit its assumptions. The gold-standard model over-predicted the White British share by an average of 4 percentage points over just 10 years, so projections resting on it are likely to be slow rather than fast. That is a statement about models built on modelled fertility, mortality and migration rates. It is not a statement about every projection in use, including ours: this site’s model takes observed Census-to-Census ratios instead, and on its own out-of-sample test it is close to unbiased in either direction.
Our own model addresses this by using observed Census-to-Census ratios rather than modelled component rates. Hamilton-Perry v8.0 (Census 2011 DC2101EW observed base and Census 2021 direct observations, 20 ethnic groups) was tested out of sample by fitting 2001 to 2011 and forecasting 2021, scored against the actual Census 2021 across 285 areas: MAE 1.56pp, bias +0.05pp. That is comparable with NEWETHPOP’s 3.95pp because both are genuine forecast errors rather than fits to their own test data.
Correction, 23 August 2026. This article previously reported NEWETHPOP’s error as 2.58pp and our own as 1.71pp, a 33 per cent improvement. Both figures are withdrawn. The 2.58pp had no backing in our published validation data, which records NEWETHPOP at 3.95pp across 296 areas, four paragraphs above where the 2.58pp appeared. The 1.71pp came from a backcast that fitted its ratios on the same two Censuses it was then tested against, so it measured the model’s own guardrails rather than its accuracy, and it had the direction of the bias backwards. The claim to be the most accurate model publicly available is withdrawn with it. The head-to-head above is the replacement, on out-of-sample figures for both models. Full limitations are documented on our methodology page, and only a one-decade horizon has been validated.
Accuracy distribution across 296 areas:
- Within 1pp: 48 areas (16%)
- Within 2pp: 108 areas (37%)
- Within 5pp: 208 areas (70%)
- Over 10pp error: 26 areas (9%)
Nobody else has published this validation. The NEWETHPOP dataset has been downloaded and cited by researchers worldwide, but no systematic comparison against Census 2021 actuals has been published. This finding is, to our knowledge, the first.
Data: NEWETHPOP Leeds2 projection (DOI: 10.5255/UKDA-SN-852508) vs ONS Census 2021 TS021 via NOMIS API. Full validation data and error tables published at asylumstats.co.uk. Methodology: Hamilton-Perry v8.0 single-year-of-age model, 20 ethnic groups, Census 2011 DC2101EW (18 groups, observed) + Census 2021 custom dataset (20 groups, direct), DfE School Census calibration, shrinkage toward the national ratio (K=25), growth ceiling of 1.65 per decade, 1,000 Monte Carlo simulations. Validated out of sample by fitting 2001 to 2011 and forecasting 2021: MAE 1.56pp, bias +0.05pp across 285 areas.
Short video summary. Share it on social media.
Share this finding. Right-click to save the image.