What is really driving ethnic change: national trend, not local migration
Correction, 12 October 2026. This piece originally gave the national effect as -6.4pp and said the decomposition covered 305 local authorities. The -6.4pp was not computed from the Census for 2011: every 2011 population total in the data was zero, because the script that read the 2011 Census table did not recognise its “All usual residents” row, so the calculation fell back to a typed 80%. It also did not match the national fall this piece quoted, 80.5% to 74.4%, which is 6.1 points. The data has held 307 decomposed areas throughout. With the real totals, the national effect is -6.2pp: across the 307 authorities whose boundaries allow a 2011 to 2021 comparison, the White British share fell from 79.7% to 73.5% (Census 2011 KS201EW and Census 2021 TS021). Burnley’s split is now 81% national trend, 6% age structure and 13% local, against 84%, 5% and 11% before. The piece also named Tower Hamlets and Newham as areas where local migration dominates; in this decomposition both are led by the national trend, before and after the correction.
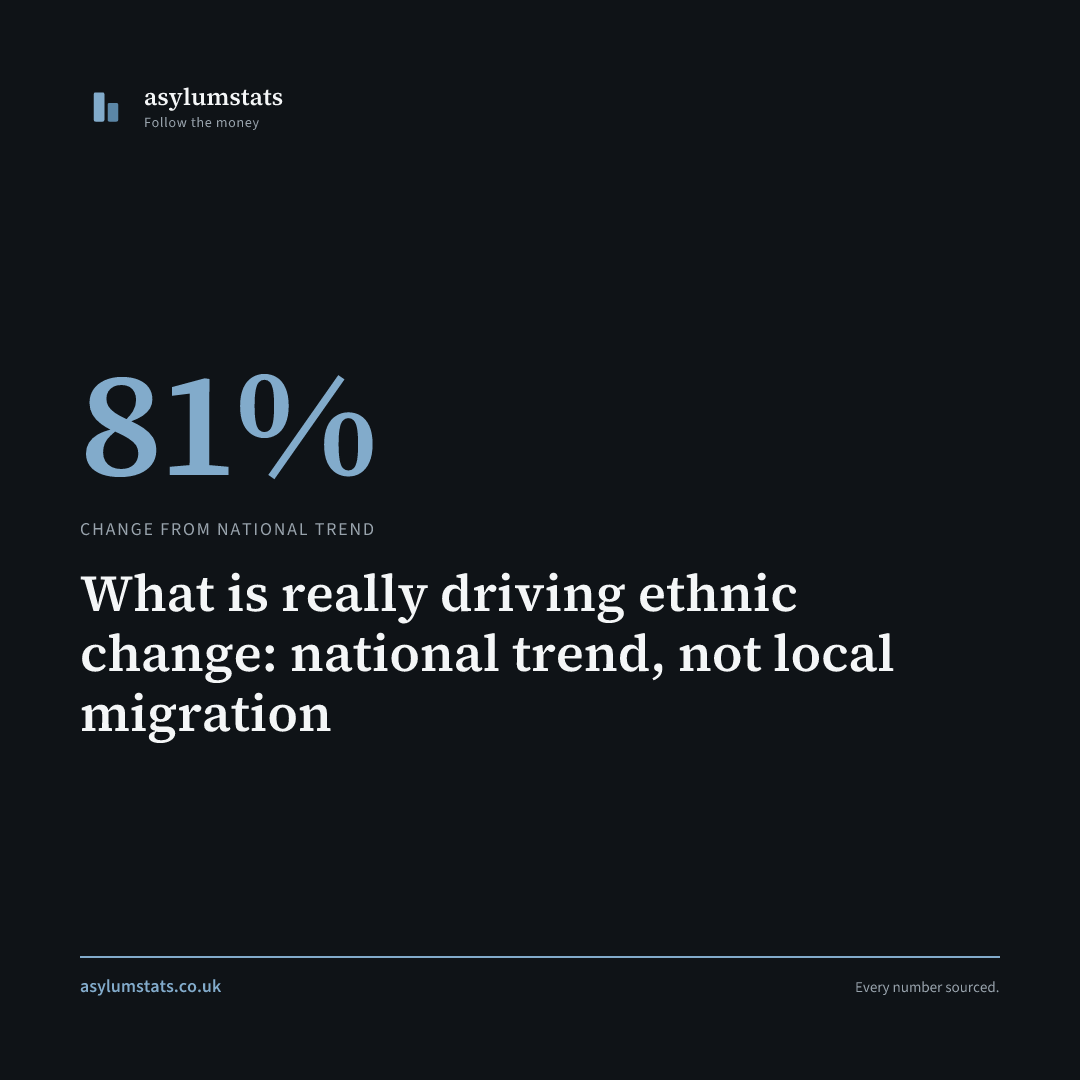
Burnley’s ethnic change is not mainly about Burnley. It’s about Britain.
We decomposed the 2011-2021 White British decline in every local authority into three components: national trend, age structure, and local migration. In Burnley, the breakdown is:
- National effect: -6.2pp (81% of total change)
- Age structure: -0.5pp (6%)
- Local migration: -1.0pp (13%)
Burnley’s total WBI decline: -7.6pp (from 85.5% to 77.9%). 81% of that is the national trend. Burnley would have seen almost the same change even with zero local migration, because the White British share fell from 79.7% to 73.5% across the 307 authorities compared (80.5% to 74.4% for England and Wales as a whole).
The national trend is the largest of the three components in 266 of the 307 areas. The local component is the largest in the other 41. In 21 of those it pulls the White British share down faster than the national trend, among them Barking and Dagenham, Hillingdon, Luton, Slough, Watford and Cambridge. In the other 20, mostly rural areas such as the Isle of Anglesey, Gwynedd and Torridge, it works the other way: the White British share fell by less than the national trend.
Data: ONS Census 2011 table KS201EW (ethnic group) and Census 2021 table TS021 (ethnic group), local authorities in England and Wales, via NOMIS. The national effect is calculated over the 307 authorities with a 2011 record on the same boundaries; the eleven authorities created after 2011 are left out. Percentage shares of Burnley’s change are taken from the unrounded components. Shift-share methodology following Franklin (2014, Population, Space and Place).
Share this finding. Right-click to save the image.